Key Takeaways
Forecasting models help project managers make better decisions under uncertainty. Linear regression, moving average and exponential smoothing are useful for simpler forecasts, while ARIMA, neural networks and econometric models need stronger data and expertise.
Forecasting models give project managers a structured way to make better decisions when the future is uncertain.
Projects rarely unfold exactly as planned. Costs shift, timelines move, resources become constrained and risks emerge with little warning. That is why forecasting is increasingly part of modern project delivery capability, but it depends on more than software. PMI’s 2024 Pulse of the Profession report found a 73.8% average project performance rate across respondents, while 64% of senior leaders said their teams need new technical skills.
For project managers, this matters. Forecasting models can help teams spot potential problems earlier, allocate resources more effectively and make informed decisions before issues become critical, but only when they understand how to choose and apply the right model.
In this article, we explore seven forecasting models every project manager should know, looking at how different forecasting methods and algorithms use historical data to predict future values and support better project outcomes.
Table of contents
Before Choosing a Forecasting Model
1. Linear regression
2. Moving average
3. Exponential smoothing
4. ARIMA (autoregressive integrated moving average)
5. Neural network models
6. Econometric models
7. Delphi method
Using forecasting models with PM3
FAQs
Before choosing a forecasting model
Before we get into the details of each forecasting model, it is worth pausing on one important point: the best model is not always the most advanced one.
The right choice depends on what you need to forecast, the data you have available and how easy the result needs to be to explain. In many cases, a simple model that supports a clear decision is more useful than a complex model that stakeholders do not understand.
Use the table below as a quick guide to where each model fits.
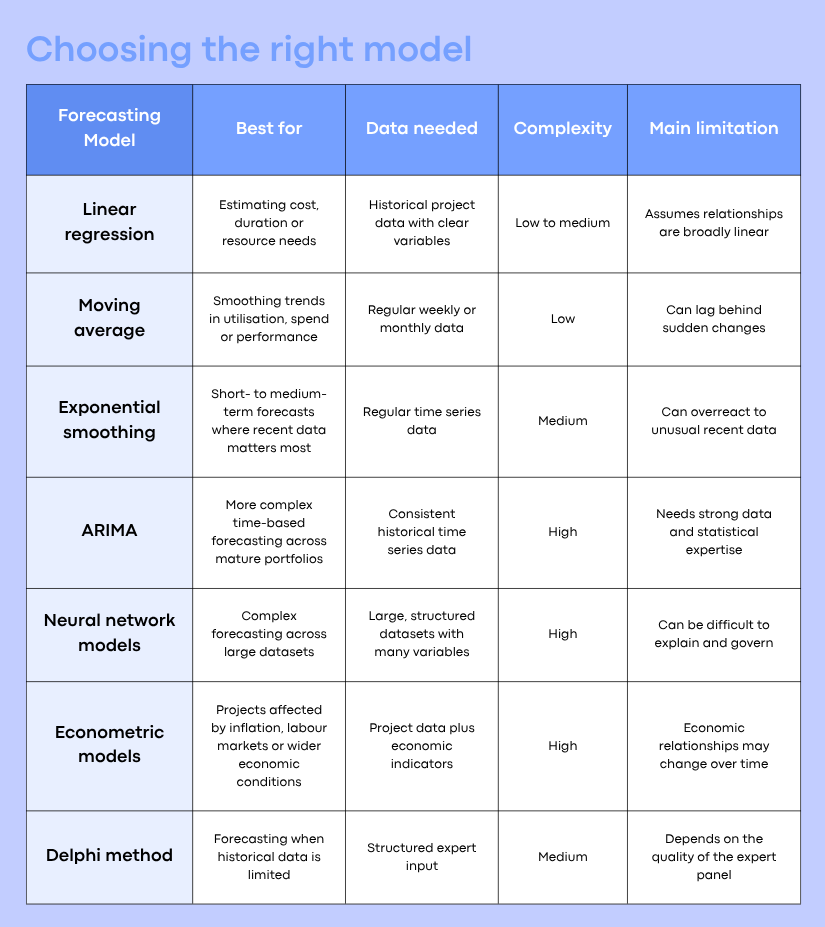
With that context in mind, the next step is to look at how each forecasting model works in practice. We’ll start with linear regression, one of the most accessible ways to connect project data with future cost, schedule or resource estimates.
Linear Regression
Linear regression is one of the most accessible forecasting models for project managers because it looks for a measurable relationship between project variables. It can help estimate an outcome, such as cost or duration, based on one or more known factors, such as project size, team capacity, workstream count or previous delivery performance.
There are two common types. Simple linear regression uses one variable to predict an outcome. For example, a project manager might estimate delivery time based on the number of requirements. Multiple linear regression uses two or more variables, which makes it more useful in complex project environments where cost or schedule performance is influenced by several factors at once.
When linear regression is useful
Linear regression works best when you have reliable historical data and a reasonably consistent relationship between the variables you are analysing. In project management, it can be particularly useful for:
- Estimating project costs based on size, duration and team structure
- Forecasting delivery timelines using historical project data
- Understanding how resource levels affect project completion dates
- Identifying which project variables have the strongest relationship with budget or schedule variance
For example, a PMO delivering a series of software implementation projects could use linear regression to estimate future delivery costs. The model might compare historical project size, number of integrations, team size, project duration and final cost. This would give project managers a more evidence-based starting point for budget planning, rather than relying only on assumptions or previous estimates.
The value is not just the forecast itself. Linear regression can also show which variables appear to have the greatest influence on the outcome. If project duration has a stronger relationship with cost than team size, for instance, that insight can help managers focus more closely on schedule risk during planning.
How linear regression works in practice
A professional services team is preparing estimates for a new client onboarding programme. Previous projects show that final cost tends to rise with the number of business units involved, the number of systems being integrated and the length of the discovery phase.
Using multiple linear regression, the team builds a forecast based on these variables. The model supports an early budget range and helps the project sponsor understand why a larger contingency may be needed for more complex clients.
The caveat is that the model only reflects patterns in past projects. If the new programme involves an unfamiliar technology, a new supplier or a major change in delivery approach, the forecast should be treated as a guide rather than a firm prediction.
Advantages and limitations
Linear regression is useful because it is relatively easy to understand, explain and apply. This makes it a good option for project teams that want to improve forecasting without introducing overly complex analytics. It also provides clear outputs that can support conversations with sponsors, finance teams and senior stakeholders.
However, linear regression assumes that the relationship between variables is broadly linear. That will not always be true. It can also be sensitive to outliers, incomplete data or major changes in delivery conditions. For this reason, it works best when combined with project judgement, not used as a substitute for it.

PPM for Regulated Institutions: Governance, Audit Readiness, and Risk Control
Discover practical strategies for improving oversight and audit readiness.
Moving average
Moving average is a forecasting method that smooths short-term fluctuations in data so project managers can see the underlying trend more clearly. Instead of reacting to every spike or dip, teams can use a moving average to understand whether performance, cost, demand or resource usage is genuinely changing over time.
This makes it useful for project environments where data is collected regularly, such as weekly progress updates, monthly budget reports or resource utilisation figures across a portfolio.
There are several types of moving average. A simple moving average gives equal weight to each data point in the chosen period. A weighted moving average gives more importance to recent data. An exponential moving average also prioritises recent data, but does so in a more gradual way, making it more responsive to change.
When moving average is useful
Moving average works best when project managers need to identify a trend in time-based data. It is particularly useful when the raw data is noisy, inconsistent or affected by short-term variation.
In project management, moving average can help with:
- Tracking resource utilisation across a PMO
- Monitoring cost or burn rate trends over time
- Smoothing delivery performance against planned milestones
- Forecasting recurring demand for project support, materials or specialist skills
For example, a PMO might use a three-month moving average to analyse resource utilisation across its project portfolio. One month of high utilisation may not be a problem on its own, especially if it follows a quieter period. But if the moving average rises steadily over several months, it may signal a capacity issue that needs action.
That insight can support decisions such as delaying lower-priority work, hiring contractors, rebalancing workloads or challenging whether all active projects should continue at the same pace.
How moving average works in practice
A central PMO is reviewing monthly utilisation data across business analysts, project managers and technical specialists. The raw figures vary from month to month because of annual leave, project start dates and short bursts of delivery activity.
To avoid overreacting to one unusually busy month, the PMO applies a rolling three-month moving average. This shows that technical specialist utilisation has been rising consistently, even though the monthly figures looked uneven.
The forecast supports a decision to bring in short-term contractor support for two upcoming implementation projects. It also gives senior leaders clearer evidence that the issue is not just a temporary spike.
The caveat is that moving averages can lag behind sudden changes. If a major project is cancelled, delayed or approved unexpectedly, the forecast may take time to reflect the new reality. For this reason, moving average forecasting works best when it is reviewed alongside live project knowledge and upcoming portfolio decisions.
Advantages and limitations
Moving average is simple, transparent and easy to explain to stakeholders. It is useful when project managers want to reduce noise in the data and focus on the direction of travel rather than individual data points.
However, it is less effective when conditions change quickly. It can also hide important short-term risks if the averaging period is too long. A six-month moving average may show a stable trend, for example, while masking a serious issue that has emerged in the last few weeks.
Moving average is best used for regular trend monitoring, not for forecasting complex projects with many changing variables.

How to Choose the Perfect Project Portfolio Management Tool for Your Organisation
Learn more about selecting the right project portfolio management tool for your organisation
Exponential smoothing
Exponential smoothing is useful when recent project data should carry more weight than older data. Like moving average, it helps project managers identify trends in time-based data, but it responds more quickly when the latest results suggest that something is changing.
That makes it valuable for forecasts where last quarter’s performance may be more relevant than what happened two years ago. For example, a delivery team may have improved its velocity, changed suppliers or introduced a new governance process. In those cases, older project data can still be useful, but it should not always influence the forecast as strongly as more recent performance.
There are three common forms of exponential smoothing:
-
Single exponential smoothing, for data without a clear trend or seasonal pattern
Double exponential smoothing, also known as Holt’s method, for data with a trend
Triple exponential smoothing, also known as Holt-Winters, for data with both trend and seasonality
For project managers, the choice depends on what the data is showing. If workload is broadly stable, single exponential smoothing may be enough. If delivery times are gradually increasing, double exponential smoothing may be more appropriate. If demand rises at predictable points in the year, such as annual planning, regulatory reporting or budget cycles, triple exponential smoothing may give a more realistic forecast.
Where exponential smoothing adds value
Exponential smoothing is especially useful for short- to medium-term forecasts where the most recent data is likely to be a strong indicator of what happens next.
In project management, it can support:
- Timeline forecasting when recent delivery performance has changed
- Budget forecasting where current spending patterns are more relevant than older averages
- Workforce planning for recurring periods of higher demand
- Demand forecasting for shared project services, such as PMO support, testing teams or specialist technical resources
A useful example is a transformation PMO that sees a recurring increase in demand during annual planning and budget approval cycles. Triple exponential smoothing could help the team forecast when demand for business analysts, finance support and project reporting will rise again. This gives leaders more time to adjust capacity, rather than waiting until bottlenecks appear.
A more responsive forecast, with some trade-offs
The main advantage of exponential smoothing is responsiveness. It can adapt more quickly than a simple moving average when recent data shows a genuine shift in performance.
For example, a software delivery team might use exponential smoothing to forecast sprint completion rates after changing its delivery process. If the last few sprints show higher throughput, the model can reflect that improvement faster than a moving average that gives equal weight to older, less relevant data.
However, this responsiveness can also be a weakness. If recent data is unusual rather than meaningful, the forecast may overcorrect. A single month of unusually high spend, a temporary team absence or a one-off supplier delay can distort the forecast if the smoothing settings are too sensitive.
This is why exponential smoothing works best when project managers understand the story behind the data. The model can show that the trend has changed, but it cannot explain whether the change is permanent, temporary or caused by an exceptional event.
Advantages and limitations
Exponential smoothing is relatively easy to understand and works well for regular time series data. It is useful when teams need forecasts that are more responsive than a moving average, especially for short- and medium-term planning.
Its limitations are mainly around judgement and configuration. The model depends on choosing appropriate smoothing parameters, and it may struggle with sudden shocks, outliers or structural changes in the project environment. It is also less useful when there is limited historical data or when future performance will be shaped by decisions that are not visible in the data.
For project managers, exponential smoothing is best used as an early warning tool. It can highlight emerging changes in performance, demand or cost, but the forecast should always be reviewed against known project events, risks and upcoming decisions.

Banking Compliance: Strategic PMO Guide for Project Management in Banking
See how PMOs improve compliance and delivery in financial services
ARIMA
ARIMA, which stands for autoregressive integrated moving average, is a more advanced time series forecasting model. It is designed for data where past values, trends and previous forecast errors can all help explain what might happen next.
For project managers, ARIMA is most useful when there is enough historical data to reveal meaningful patterns over time. It is less suited to one-off projects with limited data, and more relevant to portfolios, programmes or operational project environments where teams track the same measures consistently.
For large portfolios, forecasting is not an academic exercise. The UK Government Major Projects Portfolio included 227 major projects with a combined whole-life cost of £834bn in 2023–24. In environments of that scale, even small improvements in forecasting can support better decisions around funding, capacity, delivery confidence and risk exposure.
What makes ARIMA different?
ARIMA combines three elements:
-
Autoregression, which uses past values to help predict future values
Integration, which adjusts the data to make trends more stable and easier to model
Moving average, which accounts for previous forecast errors
In simpler terms, ARIMA looks at what has happened before, how the pattern is changing and where previous forecasts have been wrong. That makes it more powerful than a basic moving average, but also more demanding.
A project manager does not need to understand every technical setting behind ARIMA. However, they do need to know when the model is appropriate, what data it depends on and how much confidence to place in the output.
Where ARIMA can support project decisions
ARIMA is well suited to forecasting regular project or portfolio measures, such as:
- Monthly project spend across a large programme
- Resource demand across a portfolio
- Average delivery times for repeatable project types
- Backlog levels, support demand or change request volumes
- Forecast completion trends across multiple similar projects
For example, a public sector transformation portfolio may track monthly spend, milestone slippage and resource demand across dozens of workstreams. ARIMA could help forecast whether current delivery pressure is likely to continue, worsen or stabilise over the next few reporting periods.
That forecast could support decisions about whether to rephase work, increase delivery capacity, review supplier commitments or escalate risks to the portfolio board.
ARIMA in a portfolio setting
A PMO responsible for a multi-year infrastructure programme is monitoring monthly cost variance across several related projects. The data shows repeated fluctuations, but it is not clear whether these are short-term reporting effects or signs of a more persistent trend.
By applying ARIMA to the monthly variance data, analysts can model the pattern over time and produce a forecast for the next few reporting cycles. The forecast suggests that cost pressure is likely to continue, even after accounting for normal month-to-month variation.
This gives the programme board stronger evidence to review contingency, challenge optimistic recovery plans and reassess the timing of lower-priority work.
The limitation is that ARIMA only works with the data it can see. It will not automatically account for a new policy decision, a supplier failure, a planning delay or a sudden change in funding. Those factors still need to be added through human judgement and scenario planning.
Advantages and limitations
ARIMA can produce strong forecasts when the data is consistent, time-based and rich enough to support modelling. It is particularly useful for project environments where trends develop over time and where previous performance is a reasonable guide to near-term future performance.
However, it is not a lightweight model. It requires careful setup, enough historical data and statistical knowledge to interpret the results properly. It also assumes that the underlying patterns in the data are stable enough to be useful.
For most project managers, ARIMA is not the first model to reach for. It is best used when simpler methods are too limited, the forecast has material consequences and there is enough data maturity to justify a more advanced approach.

The Secret to Flawless Scheduling in Project Management
Master project scheduling with practical insights.
Neural network models
Neural network models are machine learning forecasting models that can identify complex patterns in large datasets. Unlike simpler models, they can work with many variables at once and detect non-linear relationships that may not be obvious through traditional analysis.
Interest in these models is rising as AI becomes more widely used in business. McKinsey’s 2025 State of AI survey found that 78% of respondents said their organisations used AI in at least one business function in 2024, up from 72% in early 2024 and 55% a year earlier. For project managers, that wider adoption creates new opportunities for forecasting, but it also raises the bar for data quality, governance and explainability.
Neural networks can be useful in complex project environments, especially where forecasts are based on large volumes of structured data. However, they are not automatically better than simpler forecasting models. In many project settings, their complexity can create as many problems as it solves.
The key question is not whether a neural network can produce a useful forecast. It is whether the organisation has enough good-quality data, the right expertise and a clear way to use the output in decision-making.
When neural networks may be appropriate
Neural networks are most relevant when project teams are working with large, varied and frequently updated datasets. They are less useful for small portfolios, one-off projects or situations where the available data is patchy.
In project management, possible applications include:
- Predictive maintenance in asset-heavy projects
- Forecasting risk patterns across large portfolios
- Predicting resource demand using multiple internal and external variables
- Analysing complex delivery patterns across many similar projects
- Forecasting demand in supply chains or customer-facing transformation programmes
For example, an energy company delivering a portfolio of infrastructure upgrades might use a neural network to forecast equipment maintenance needs. The model could draw on sensor data, maintenance records, environmental conditions, asset age and previous failure patterns. This could help project teams schedule maintenance work before failures disrupt delivery.
This is a stronger use case than applying neural networks to a small set of project plans. The model has enough data to learn from, and the forecast supports a practical decision: when to intervene before the cost of failure becomes higher.
The judgement problem
The main challenge with neural networks is explainability. They may produce a useful forecast without making it easy to understand why the model reached that conclusion.
That matters in project management. A project manager usually needs to explain a forecast to sponsors, finance teams, delivery leads or governance boards. If the model predicts a high risk of delay, leaders will want to know what is driving that risk and what action they can take.
A forecast that cannot be explained may be difficult to trust, especially in regulated, public sector or high-value project environments. It may also be difficult to challenge. If stakeholders cannot see whether the model is relying on sensible signals or misleading patterns, the forecast can create false confidence.
Advantages and limitations
Neural networks can be powerful when there is enough data and the forecasting problem is genuinely complex. They can identify patterns across many variables and may improve as more relevant data becomes available.
However, they require significant data maturity, technical expertise and governance. They can be expensive to build and maintain, difficult to explain and unsuitable for teams that only need a clear, auditable forecast.
For most project managers, neural networks should not be the default option. They are best suited to organisations with large portfolios, repeatable project data and the ability to combine machine learning outputs with human review. If stakeholders cannot understand, challenge or act on the forecast, a simpler model is usually more valuable.

Regulatory Change Management: Proven Strategies to Stay Ahead in a Shifting Financial Landscape
Learn how to stay ahead of constant regulatory updates with practical strategies for resilient regulatory change management.
Econometric models
Econometric models use statistical methods to understand how economic variables influence outcomes. In project management, they are most useful for projects and programmes that are exposed to wider market conditions, such as construction, infrastructure, energy, transport, finance and public sector investment.
This makes them more specialised than many of the other forecasting models in this article. A project manager delivering an internal process improvement project may not need an econometric model. But for a multi-year infrastructure programme, changes in inflation, interest rates, labour availability or commodity prices can have a major impact on cost and schedule forecasts.
Where econometric models are useful
Econometric models can help project teams understand how external factors may affect project performance. Relevant variables might include:
- Inflation and interest rates
- Labour market constraints
- Exchange rates
- Commodity prices, such as steel, oil or energy
- GDP growth or regional economic activity
- Policy changes, tax rules or public funding decisions
For example, a construction PMO managing a portfolio of capital projects might use an econometric model to forecast how inflation, labour shortages and material price changes could affect future project costs. This could support decisions about contingency, procurement timing, contract terms or whether to rephase work.
Advantages and limitations
The strength of econometric models is that they connect project forecasts to the wider economic environment. This can make them valuable for long-term planning, investment decisions and projects with significant exposure to market conditions.
Their limitation is complexity. Econometric models require good economic data, careful model design and a clear understanding of which variables genuinely matter. They also assume that relationships between variables remain reasonably stable over time, which may not hold during shocks such as policy changes, supply chain disruption or rapid inflation.
For most project managers, econometric models are not a day-to-day forecasting tool. They are best used for high-value projects where external economic conditions can materially affect delivery decisions.

What Is a Decision Log? A Guide for Project Managers
Learn what a decision log is in project management, why it’s essential for tracking key decisions, and how to use a decision log to improve transparency, accountability, and project governance.
Delphi method
The Delphi method is a qualitative forecasting technique that uses structured expert judgement. It is especially useful when historical data is limited, the project is new or the forecast depends on factors that are difficult to measure.
Instead of relying on one senior opinion or an open workshop, the Delphi method gathers views from a panel of experts over several rounds. Responses are usually anonymised, summarised and shared back with the group so participants can refine their views without being influenced too heavily by hierarchy, group pressure or the loudest voice in the room.
This makes it valuable for early-stage projects, strategic planning and high-uncertainty programmes where data alone cannot provide a reliable forecast.
Where the Delphi method works well
The Delphi method can support forecasts around:
- Emerging project risks
- Regulatory or policy change
- New product or service demand
- Long-term technology adoption
- Strategic investment decisions
- Delivery risks in unfamiliar project environments
For example, a project team planning a new regulatory transformation programme may not have directly comparable historical data. The scope may depend on future guidance, stakeholder interpretation, legal complexity and how quickly different business units can respond.
In that situation, a Delphi process could bring together experts from compliance, legal, operations, technology, finance and delivery. Their input could help forecast likely risk exposure, implementation complexity and the level of contingency needed.
How the Delphi method works in practice
A PMO is preparing a forecast for a new cross-border regulatory change programme. The organisation has delivered compliance projects before, but not one with the same legal uncertainty, technology impact and stakeholder complexity.
The PMO asks a panel of experts to estimate the most likely delivery risks, expected implementation effort and areas where cost could escalate. After the first round, the responses are summarised and shared anonymously. Experts then review the group view and revise their estimates in a second round.
The final forecast does not remove uncertainty, but it gives the programme board a more balanced view of the likely risk profile. It also highlights where expert opinion is divided, which may be just as important as where there is consensus.
The decision supported is whether to approve the initial delivery plan, increase contingency, commission further discovery or delay commitments until the regulatory position is clearer.
Advantages and limitations
The Delphi method is useful because it captures expert judgement in a structured way. It can reduce the influence of seniority or groupthink, and it works well when quantitative data is unavailable or unreliable.
Its main limitation is that it depends heavily on the quality and diversity of the expert panel. A narrow group will produce a narrow forecast. The process can also take time, especially if several rounds are needed to reach a useful level of agreement.
For project managers, the Delphi method is best used when uncertainty is high and historic data is weak. It should not replace quantitative forecasting where good data exists, but it can add valuable context where numbers alone are not enough.
Using forecasting models with PM3
Forecasting models are only useful when project teams can turn their outputs into better decisions. That is where a PPM tool such as PM3 can help.
PM3 is designed to give organisations clearer visibility across portfolios, programmes and projects, so teams can manage complexity without losing sight of outcomes. When forecasting is part of project planning, reporting or portfolio review, PM3 can help bring the right information together in one place.
FAQs
What are the 5 C’s of project management?
The 5 C’s of project management are often described as clarity, communication, collaboration, control and closure. Together, they help project managers define what needs to be delivered, keep stakeholders aligned, manage work effectively and ensure the project is completed with clear outcomes.
What are the different types of forecasting in project management?
The main types of forecasting in project management are quantitative forecasting and qualitative forecasting. Quantitative forecasting uses data, such as cost, schedule, resource or performance history, to predict future outcomes. Qualitative forecasting uses expert judgement, stakeholder insight or scenario planning when reliable historical data is limited.
What are the 7 steps to forecasting?
The seven steps to forecasting are:
1. Define what you need to forecast.
2. Gather relevant data.
3. Check the quality and consistency of the data.
4. Choose the most appropriate forecasting model.
5. Build or apply the forecast.
6. Review the output against project context and known risks.
7. Use the forecast to support decisions, then update it as conditions change.
What are the most common forecasting models?
The most common forecasting models include linear regression, moving average, exponential smoothing, ARIMA, neural network models, econometric models and the Delphi method. The right model depends on the type of project, the data available and whether the forecast needs to support short-term planning, long-term strategy or expert judgement in uncertain conditions.
Main Image: Astrid IQ
